Visualization Element: Trend
Symbol:

Category: Special Controls
The element displays the curve of variable values as a trend diagram. The trend diagram is suitable for representing a long-term data curve because the data is read from a trend recording and hence from a database. Moreover, you can run the Trend element together with the Date Range Picker, Legend, and Time Range Picker operating elements so that the user can navigate conveniently in the diagram.
Tip
You can programmatically delete the recorded trend curve at runtime. The recording starts again from the time of deletion.
For more information, see the following: Programming a Trend Visualization
Tip
The Trend visualization element cannot be inserted into a visualization in the POU pool.
Not available in integrated visualizations
The use of trends or alarms and the elements required for them is not provided in an integrated visualization.

Element properties
Are all element properties available?
All properties are available only after you select the Advanced option or the All categories filter in Properties.
Element name | Example: Name assignmentAssign individual names for elements so that they are found faster in the element list. |
Data source | Data source for the connection via the device and the application to the Trend Recording object where the trend data that you want to show was saved. If the Trend Recording object is on the local device, then it is sufficient when you specify the respective application. If the trend recording is on a remote device, then you need to specify the data source connection to this device.
|
Element Type | Trend |
Trend recording |
The trend recording is located on the device specified in the Data source property. For more information, see: Trend Recording |
Display settings |
|


Cursor
Show cursor |
Behavior at runtime: As soon as the graph is "drawn", the user can move the cursor along the time axis in order to mark a specific time. Then the variable value belonging to the cursor position is displayed in the legend above the graph. 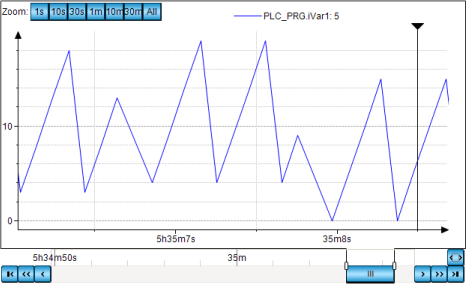 |
Show tooltip | Requirement: Show cursor is activated.
Behavior at runtime: The variable value belonging to the cursor position is displayed as a tooltip. |
Show frame |
|
Number format | Format definition in printf syntax, which determines how the values are displayed in the tooltip and in the legend Example: |
Default time range | Default time value for the available time range Example: |

Tick mark labels
Tip
The time stored in the trend recording are in the UTC time zone. If the time is displayed in the trend of the visualization element, then the timestamps are converted to the local time zone of the operating system of the PLC.
Change the time zone in the operating system if the times in the trend diagram are not in the zone that you need.
Tip
You can programmatically switch the local time zone of the system time to universal time (UTC).
When the variable VisuElems.Visu_DateTime.DisplayUTC is set to TRUE, the system time is displayed as universal time (UTC). By default, the variable VisuElems.Visu_DateTime.DisplayUTC is set to FALSE so that the system time is displayed in the local time zone.
For the display of date and time values, you can extend the respective format string with the time zone code Z. For an output in local system time, the offset is then displayed in universal time (UTC). For example, dd:MM:yyyy HH:mm:ss:ms:Z outputs 01.08.2021 12:00:00:001:+02:00. When universal time (UTC) is displayed, the UTC code is also displayed. 01.08.2021 10:00:00:001:Z
Time stamps | X-value of the trend diagram
|
Draw labels on two lines |
|
Omit irrelevant information in timestamps |
|
Internationalization (format strings) | Format definition for the date and time display of the timestamp (when it is displayed in full) NoteThe property is visible only if the Omit irrelevant information in timestamps option is not selected. TipBasically, all |
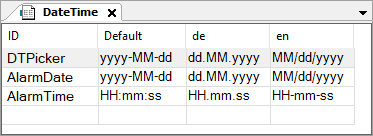
Date | Format string that returns the date display according to the defined format. The operating system locale is used as the default setting. Options for specifying the format string
. Defined format strings for the date:
Example:
|
Time | Format string that returns the time (or time of day) display according to the defined format. The operating system locale is used as the default setting. . Defined format strings for the time:
Example:
|

Position
The position defines the location and size of the element in the visualization window. This is based on the Cartesian coordinate system. The origin is located in the upper left corner of the window. The positive horizontal X-axis runs to the right. The positive vertical Y-axis runs downwards.
X | The X-coordinate (in pixels) of the upper left corner of the element Example: |
Y | The Y-coordinate (in pixels) of the upper left corner of the element Example: |
Width | Specified in pixels Example: |
Height | Specified in pixels Example: |
Tip
You can change the values by dragging the box  symbols to other positions in the editor.
Assigned controls
These elements are created automatically when Insert Elements for Trend Controlling is used to add the controls.
Date Range Picker | Control for changing the date and time of the displayed data sets With |
Time range picker | Control for changing the time of the displayed data sets With |
Legend | Control for displaying a legend for the graphs With |

Control variables
Zooming the displayed curve is done by means of the mouse, or the pinch gesture on a multitouch device. It also applies to all axes. At runtime when Enable is Zooming and panning can work together. | |
Enable | Variable (
Example: |
Home | Variable ( Rising edge: Reset the displayed curve to the initial state after the display has changed due to zooming. Example: |
Undo | Variable ( Rising edge: Reset the displayed curve to the previous position after the display has changed due to zooming. Example: |
Is zoomed | Variable (
Example: |
Panning the displayed curve is done by means of the mouse or the pinch gesture on a multitouch device. It also applies to all axes. At runtime if Enable is | |
Enable | Variable (
Example: |
Home | Variable ( Rising edge: Reset the displayed curve to the initial position after the display has changed due to panning. Example: |
Is panned | Variable (
Example: |
Enable for Y-axis | Variable (
|
The control variables described below (Date Range Start and Date Range End) can be used to programmatically control the time range of the trend. This allows you to program your trend visualization without the Time Range Picker visualization element. However, if you want a visualization user to be able to specify a time range as well, then add the time range picker element. The times in the time range picker element and in the IEC variables are automatically kept synchronized. Note: Make sure that each trend has its own variable, otherwise the trend recording will stop. Hint: To give the user an indication of why the trend has been halted, the | |
Date Range Start | IEC variable ( If the value changes, then the trend recording is stopped. Example: |
Date Range End | IEC variable ( For the If the value changes, then the trend recording reacts as follows: When the value increases, the trend recording is started. When the value decreases, the trend recording is ended. Example: |

Center
The properties contain fixed values for the coordinates of the point of rotation. The rotation point is displayed in the editor as the  symbol and is used as the center for rotation and scaling.
Tip
You can also change the values by dragging the symbol to another position in the editor.
X | Editable X-coordinate of the point of rotation Double-clicking in the value field will open the line editor. |
Y | Editable Y-coordinate of the point of rotation Double-clicking in the value field will open the line editor. |
Absolute movement
The properties can be assigned to IEC variables for controlling the position of the element dynamically. The reference point is the upper left corner of the element. At runtime, the entire element is moved.
Movement | ||
X |
Increasing this value at runtime moves the element to the right. | |
Y |
Increasing this value at runtime moves the element downwards. | |
Rotation | Variable (numeric data type) for the angle of rotation (in degrees) Example: The midpoint of the element rotates at the Center point. This rotation point is shown as the At runtime, the alignment of the element remains the same with respect to the coordinate system of the visualization. Increasing the value rotates the element to the right. | 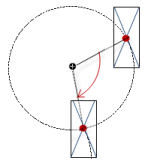 |
Interior rotation | Variable (numeric data type) for the angle of rotation (in degrees) Example: At runtime, the element rotates about the point of rotation specified in Center according to the value of the variable. In addition, the alignment of the element rotates according to the coordinate system of the visualization. Increasing the value in the code rotates clockwise. The rotation point is shown as the NoteIf a static angle of rotation is specified in the property, then the static angle of rotation is added to the variable angle of rotation (offset) when the visualization is executed. | 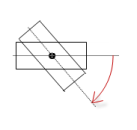 |
Tip
You can combine the variables to a Unit conversion.
Tip
The X, Y, Rotation, and Interior rotation properties are supported by the "Client Animation" functionality.
Relative movement
The properties contains variables for moving the element. The reference point is the position of the element (Position property). The shape of the element can change.
Movement top-left | |
X |
Incrementing the value moves the element to the right. |
Y |
Incrementing the value moves the element to the down. |
Movement bottom-right | |
X |
Incrementing the value moves the element to the right. |
Y |
Incrementing the value moves the element to the down. |
Relative movement
The properties contains variables for moving the element. The reference point is the position of the element (Position property). The shape of the element can change.
. Movement point[0]
| Variable (numeric data type) for the number (in pixels) which the starting point of the line is moved. Incrementing the X value moves the element to the right. Incrementing the Y value moves the element to the down. |
. Movement point[0]
| Variable (numeric data type) for the number (in pixels) that the end point of the line is moved. Incrementing the X value moves the element to the right. Incrementing the Y value moves the element to the down. |
Relative movement
The properties contains variables for moving the element. The reference point is the position of the element (Position property). The shape of the element can change.
Movement top-left | |
X |
Incrementing the value moves the element to the right. |
Y |
Incrementing the value moves the element to the down. |
Movement bottom-right | |
X |
Incrementing the value moves the element to the right. |
Y |
Incrementing the value moves the element to the down. |
State variables
The variables control the element behavior dynamically.
Invisible | Variable (
|
Tip
The Invisible property is supported by the "Client Animation" functionality.
Animation
Tip
These properties are available only when you have selected the Support client animations and overlay of native elements option in the Visualization Manager.
Animation duration | Variable for the duration (in milliseconds) in which the element runs an animation
. Animatable properties
The animated movement is executed when at least one value of an animatable property has changed. The movement then executed is not jerky, but is smooth within the specified animation duration. The visualization element travels to the specified position while rotating dynamically. The transitions are smooth. |
Move to foreground | Variable (
Example: |
Permissions
Note
Available only when a user management is set up for visualization.
Access Rights button | Opens the Access Rights dialog. There you can edit the access privileges for the element. . Status messages:
|